Real time stock charts are important analysis tool for every trader. They allow one to monitor price development in real time.
But do you need realtime stock charts ?
Realtime charts are often set up for monitoring of real intraday time price development. They are very important for a day trader who is opening and closing his/her trades during the same day. Also, swing traders have their intraday charts set up as their positions can last several hours or a few days.
But what if you are a position trader or active investor? Then it depends. My personal opinion is that they are not absolutely necessary. For trades lasting weeks or months you probably do not need to monitor price intraday in real time. It is ok to use delayed technical stock charts.
Intraday live stock charts for swing and position traders
I think that there are some exceptions when mid-term position traders could monitor intraday development.
- When the price of monitored shares or ETF is approaching trade entry level. It could be good to monitor overall market environment, what the situation is with stock volume and so on.
- When price of opened position is approaching target level. As price moves close to our target price, it is good to monitor price development closely. Then we can make an individual decision about exiting the trade based on intraday market conditions.
- When something unusual happens. What if share price opens with a gap and starts to trade much lower or much higher than the previous close price? Then it is really good to monitor intraday action on real time stock charts and use your predefined rules for managing gaps.
How to setup realtime charts
If you are a swing trader, it can be good to setup your charts accordingly. As your main time frame for your trades could be four hours or daily, it is good to set up at least three different time frames. Like four hours, daily, and something smaller like a 15- inutes chart. It allows you to see the bigger picture and also to micromanage entry end exit with best setting for stop losses.
If you are a position trader or active investor with a longer time-frame then you can also set daily and weekly charts as real time stock charts.
When you want to make money by trading on exchanges, then you need to use good and customizable technical price charts. So please select your broker software and chart analysis software carefully.
Esignal stock charting software real intraday charts example
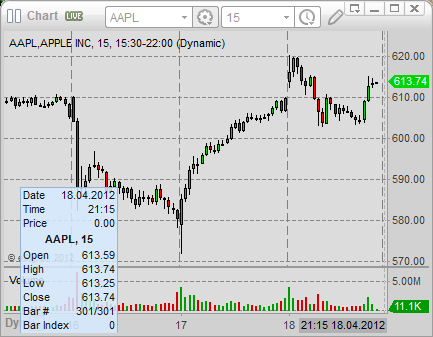
Swing and position traders could check only single intra-day live chart when needed. Esignal, my real time data provider, has also good chart analysis software and it is also possible to set up intraday realtime charts there. Here is an example of such a single technical chart of intraday development.

Find more on related pages
- Don’t miss swing and day trading rules for every trader
- What realtime stock charts to check during a trading day
- Learn more about chart reading