I like to use stock market volume as a powerful confirming technical indicator. Why ? This is the only indicator that isn’t calculated from price! High level of shares traded during a trading day indicates important market action.
There is also very good to monitor overall stock market volume of shares traded on NYSE, NASDAQ or your preferred stock market exchange. It can help you to recognize todays market situation. It is good to understand when to be aggressive trader and when to be conservative in opening new positions.
Two reasons why is analysis of stocks volume important
You have to pay closer attention to shares or market action when you see high levels of this technical indicator during these situations:
- Shares are breaking from significant area of support or resistance
- Share are bouncing from significant area of support or resistance
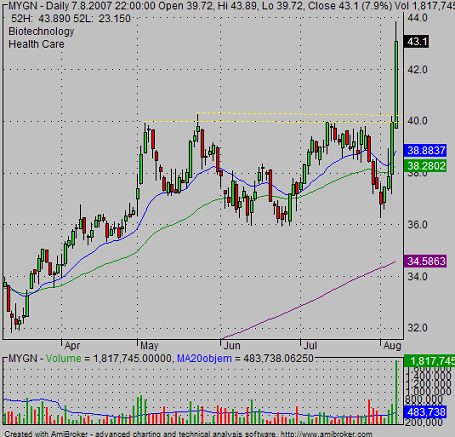
These two situations are important for us because they tell us that a new trend is developing. You want to enter trade during these days when it is confirmed by intraday monitoring of important levels. Entry price should be as close to this important S/R level as possible. Here are two chart examples:

The MYGN chart above is a nice example of breakout of resistance point with very high traders activity – number of shares traded increased extremely. Above average level of action (approx. five times more than average) allows share price to rise almost four points in one day (almost 10%) Next example:

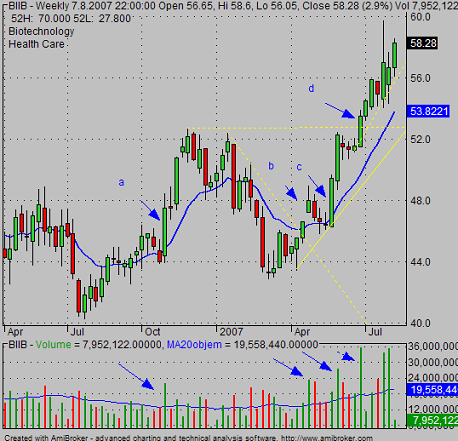
Do you see the arrows pointing to important levels of traded shares and when it happened?
- high amount of activity when bouncing from support level
- high value during breakout of trendline resistance
- high value during bounce from support
- breakout of horizontal resistance with above average number of trades
Usage during a trend move
But you can also find above-average levels of shares traded in situations when the trend is already running. After several strong moves you see that last day is accompanied by high value of traded shares. This is warning sign.
When I’m trading and see such a situation on my real-time chart, I like to take these two steps: sell or cover part of my shares into strength (1/3 at least) and move my stop closer.
Very strong activity after several trend days means that big players are trying to exit their positions into the hands of latecomers. My favorite trader Tony Oz calls them bagholders🙂 They will buy from us and allow us to realize a nice profit.
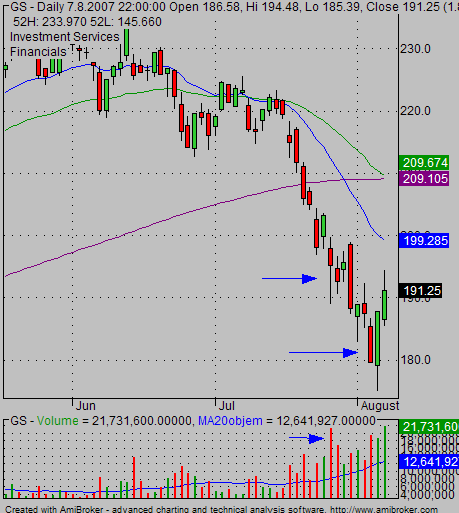
Watch this GS stock chart:

You can see extreme level of traded shares at the end of a strong decline. This is a level where fear is big. Most professionals use such days to move their short positions into the hands of the bagholders.
Stock market volume tip
Use a simple moving average to define the average level of trading action in monitored shares or market index. Put this average line into your chart, and then you can easily spot above-average levels days.
Find more on related pages
- Learn to trade flags chart patterns
- What are the important levels of stock trading volume
- Learn more ideas of profitable chart analysis