If you want to trade stock online you must decide how to prepare entries for your stock picks. Even the best stock to buy now cannot be entered blindly. Any online trade must be prepared with the best possible risk profile.
This risk profile is based on several parameters. There are entry level, stop loss level and possible target levels used for checking if such trade can have good risk reward ratio. The best stock to buy is worth trading only if it has the best risk reward ratio.
Two major stock trading strategies and entry levels
One important parameter of any stock trading setup is entry level. This level defines the price where we want to execute the entry order. Our process of trading stock online begins with this execution. It can be buying of the best stock to buy or it could be short selling the most weakest stock.
How can this level be set? Most swing traders use two basic strategies: pullback trades and breakout/breakdown trades.
These trades expect that there are important levels of support or resistance that are broken by price move in case of a breakout/breakdown trade. Or that these levels support price and arrange a major reversal that is then used for entry.
Bearish pullback strategy setup example
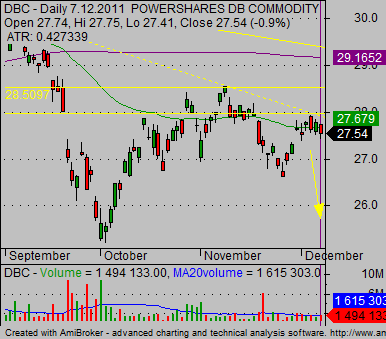
This chart is a pullback example, as the price of commodity ETF made a nice pullback to important levels of resistance. Here you can think about entering the bearish online trade for the next leg down.

Bullish breakout swing trade strategy example
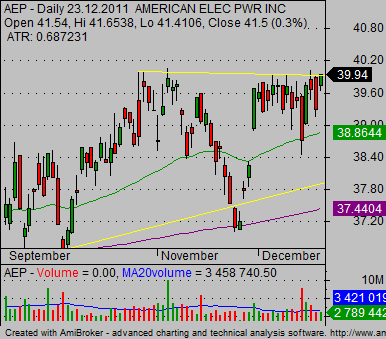
Another example is this bullish chart of AEP. Its price moves in a narrow range just under an important resistance level. You can think that this ticker is preparing for a strong breakout above this level.

How to purchase stocksusing these strategies?
But this is not telling us about where the right level for entry is. When to buy or sell short these stocks.
Let’s look at the chart of AEP. Resistance level could be seen near 40USD. When we think about the right place for buying this stock we can use two main techniques.
The first one is to use fixed value added to this resistance level. We assume that when price reaches this value above resistance that a breakout is happening. The correct level for this online stock trade could be somewhere near 40.40 USD.
ATR – technical analysis indicator
Another option is to use a technical analysis indicator named ATR, or Average True Range. This indicator defines the trading range of any particular stock in a defined period. I use this indicator value as tool for setting entry levels for my online trades with stocks or ETFs.
I use the value provided by this ATR indicator. You can see it on the chart of AEP above that it prints 0.703. I divide this value by 5 and use the result. I receive 0.14, so I add it to 40.10 and I receive a value of 40.24. And this will be my buying point for this bullish online trade. Btw, I entered this online trade in my real portfolio as a swing trade in December 2011.
How to trade stock online in a bearish trend?
Similar options are available for bearish types of trades. Again we can use the DBC chart. You can see that the price of DBC is in the 25 – 30 USD range. So the fixed value for setting of the entry point for short selling of this ETF is 0.20- 0.25. We subtract it from the lows of 27.41 and have a possible entry point near 27.20 level.
When we use the second option I mentioned – ATR calculation – we have 0.427 as our ATR value. After dividing I have 0.09, so my entry point based on this technique will be near 27.30 level. I personally entered this online trade in December 2011 in the ETF part of my trading portfolio.
Find more on related pages
- You can trade also major Nasdaq ETF symbols
- Understand reasons why to look for bearish daily stock picks
- Find more about stock trading systems