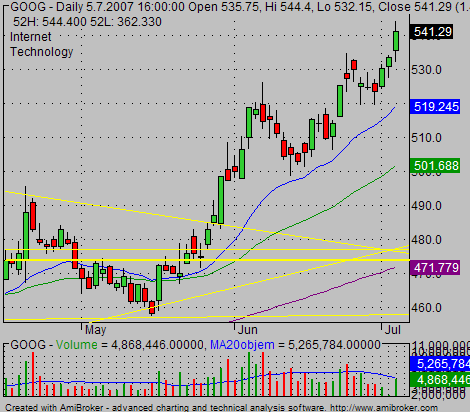
Do not avoid technical analysis of stock charts. It is very useful way that could improve your trading or investing results. You only need to understand what is important and what is not.
Using technical chart analysis you can analyze stock market or individual market tickers that could be shares, commodities, currencies or bonds.
Stock charts technical analysis is not complicated
Many people afraid that technical analysis of stock charts is complicated issue. Well it can be if you want to use many tools and indicators available.
But when learned and done properly then you’ll find it easy, simple and really effective.
When using chart analysis you’ll find everything important about the company’s shares is included in the price, and therefore you need only watch and analyze price movements. That’s great because you don’t need to learn to read annual reports, for instance, what do earnings, P/E and so on mean!
And if you are investor who likes to study fundamental values then it is good for you too. Technical reading of a price chart will provide very important know how for timing of your purchases and sells.
Why to use technical analysis of the stock market
So why to use technical market research? It can help you a lot in plenty of tasks that are related to trading or investing.
The technical market research provides an important information about price trends that help you to determine if you want to be an aggressive buyer or if you prefer to sell short shares. This analysis of share price charts also provides a good info that helps you with timing entries for your trades.
The technical chart reading give you necessary info that should be used when you make decision what to do with opened trade or with opened position in your investment portfolio. You can decide about the right trade management steps that must be done.
Learn to read stock charts
There are several different types of charts, but I recommend the one I believe is the best one: candlestick chart type.

They’re based on simple elements, candlesticks. Each candlestick represents one time period. It shows us how the price moved during this period. You can learn a lot from every single candlestick.
Find the best tools for technical chart analysis
When you want to learn to read chart properly then use good tools. They help to do this important task. I highly recommend to use some good market charting software or use some market websites that provide good charts and tools for technical chart reading and research.
Keep your chart research simple
There are a lot of tools which can be used for a price chart analysis. These tools, mostly technical indicators, can turn your research into a nightmare. So my recommendation is to keep your technical market research simple. Do not use too much indicators. If you want to use some of them, then think about how to organize them in your chart analysis software.
Find more on related pages
- Learn to set stock chart time frame for your charts
- Best ways to use free stock quotes and charts
- Find more details about strategies for traders and investors