Intra-day monitoring of stock volume is a proven way to improve market timing of your entries and exits. An abnormal volume during a trading day indicates strong action and you should be prepared to use this important information for your trading strategies.
If you have prepared a list of stocks you want to monitor for a possible swing or position trade, then it’s important to know if the current move in price of shares is accompanied with strong level of shares traded.
Every pullback move or breakout move accompanied with abnormal stock volume or above average trade activity represents a much better opportunity for profitable trade. If you want to make more profitable swing trade or daytrades then you have to monitor stock volume leaders and movers.
Use live stock market quotes in stocks trading software
Do you want to know how to monitor this value real time? It’s easy. All you need is free trading software such as Medved Trader (new product created by former creators of Quotetracker) and a real-time data source (like your broker or a specialized data provider).
Then, you have to define the list of stocks you want to monitor. Finally, you have to set a view in
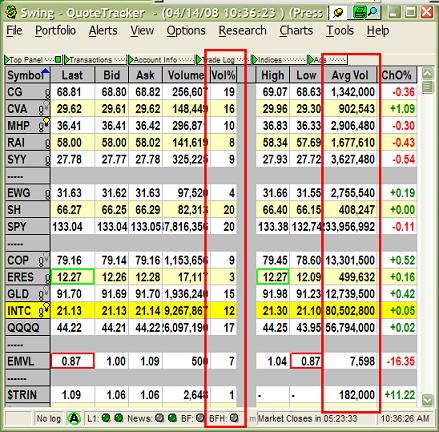
Medved Trader to include these two columns: Vol% and Avg Volume. Avg volume is average daily stock trading volume delivered from the Yahoo finance Web site. Vol% is a percent level of current volume to Average value. You can see both important columns on this screenshot from my computer monitor.

E-signal is another option that offer this good feature to see stock real-time volume levels to select leaders for current trading day.
Alternative to check intraday stock market volume
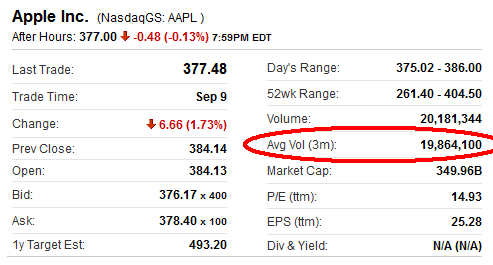
If you have not this software you can try to achieve this result by different way. Put your ticker into watchlist into your trade software. Then monitor current daily volume of these shares. Also check average volume available on Yahoo finance website. Here is example where to look for this info for AAPL :

Then you can compare current volume of stock you want to trade with average volume level you find on Yahoo site. It is also good to write 50% level of average volume. You can do it easily using Excel spreadsheet.
If you see that trading volume achieved 50% level or more during few hours after market open then you know that something is happening with these shares. And you can expect that stock trading volume at the end of the day will be higher then average level.
The broker software could be also used to monitor stock volume
Another option is to monitor todays trade volume real-time in your trade software that is provided by stocks broker. Short term traders often receive real time trading data also to this broker platform so there is possible to monitor intraday values. The only issue is if there is available also average trading volume in this platform.
Average level of trading volume is calculated value and I noticed that it is not easily accessible even in trading platform of best online brokers. So please check it with your broker.
Find more on related pages
- The important levels of stock trading volume
- Way to look for momentum hot stock picks
- Learn other ways of chart analysis