I use the swing stock trade system to trade shares on US exchanges on a daily basis. This is the core type of trade in my trading system. I have traded stocks for more than 10 years already and I have made plenty of trades. I trade both directions – bullish long trades and short sell trades. Both are defined in my system.
I would like to describe a swing stock trade example I made in 2012. This trade was a breakout a of strong horizontal resistance level. Breakout trades work well, especially in bullish environment. The breakout market strategy could also be traded in a neutral market situation but should be avoided in a bearish market situation.
Swing trading stock pick
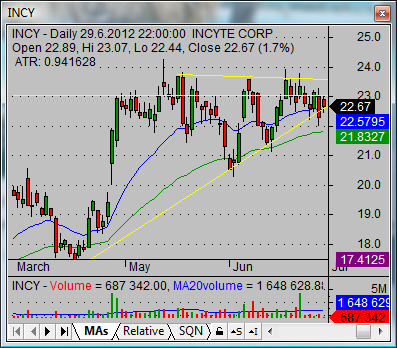
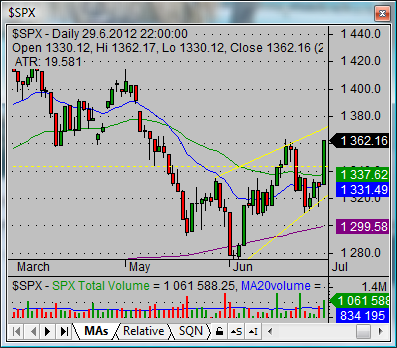
The INCY shares appeared as one result of my bullish stock screener. It looked like quite a good pick for a trade as it was sitting near all time highs in a situation when the general market index was in deep pullback.

But the same day when this ticker appeared in the results of my screener the major market index made a nice bullish move and pushed above its 50-day moving average again. It was a bullish sign in a quite neutral market situation.

Entry point for this bullish strategy
I analyzed the chart and noted two resistance levels that formed resistance area between 23 and 23.50. This resistance area could also be seen as the neckline of an inverse head-and-shoulders stock chart pattern. I expect that if the price will be able to move above this resistance area then it could make a move to a new all-time high. I have set an entry price trigger to 23.80.
Stop loss level on this price chart
I placed a stop loss level under this resistance area, as I do not want to see a deep pullback after my trigger price is touched. I would consider such action a breakout failure and want to exit the trade.
When to exit this trade
I projected a possible target level to an area near 27 USD. I used slightly lower value: 26.80. I used fibonacci retracement values for this projection. And if you use standard analysis of inverse head-and-shoulder chart pattern stock market strategy then the target level will be the same.
Risk reward ratio
Based on values for entry, stop loss level and profit target level, I was able to calculate my risk reward ratio for this particular trade. I need to have at least a 3 (profit) to 1 (risk) ratio based on money management and risk management rules in my swing stock trade system. The values I prepared showed more than a 4:1 ratio, so it fit into my trade system rules.
Management of INCY online trade
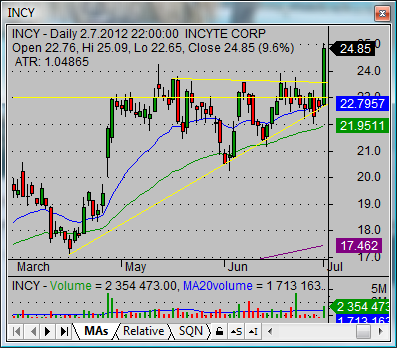
I entered the trade the next day after my analysis, as my trigger price was approached. As you can see, share price moved very strongly up and the move was accompanied with above average volume level.

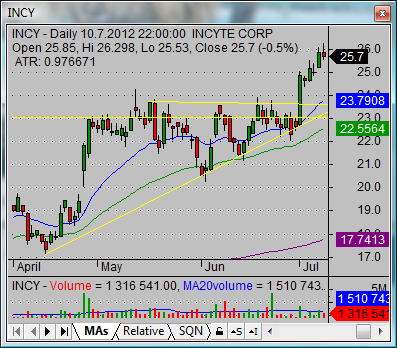
I left my stop placed in the level defined in my trade plan as described above. As price moved up the following next days I placed a stop loss right under the last daily candlestick. The price finally charted a bearish reversal candlestick. I have a special trade exit rule when this candlestick appears after some price move. So I decided to exit the trade on 10.7.2012 before market close.

Result of this profitable stock trade system strategy
The final result for this profitable strategy was 1.83 USD per each share I traded. If you could do this trade with 500 shares then final profit from this trade would 915 USD.
Find more on related pages
- What order to use in the best online stock trade
- Trade stock online with ideal entry level
- Learn other details about stock trading strategies