This stock market tutorial will describe some techniques that should help you to know when to sell stocks you have in your portfolio. Good knowledge of the situation when you can expect some sell-off is important know-how for best results of your online trading or investing in shares.
The most known idea is to hold your winning positions in you portfolio as long as is possible. Riding a strong uptrend for a long time period is the most important task in online securities trading. Active investors and traders want to catch their biggest winners and hold them through most of their rising uptrend.
It is not possible to buy stock at the lowest low and sell at its highest high during a trend. It is pure good luck when such a result is achieved. A typical bullish trade is finished sooner – before the maximum possible high is reached – or later, when share price is already in decline from its maximal high.
But it is not a problem as you can see in this tutorial. The outcome that you as a profitable trader want to achieve is to catch the maximum from the trend move, not the whole trend move. This stock market tutorial should help you to achieve these best results.
Good indicators for monitoring of stock market trend health
I personally use trend analysis a lot in my position and swing trading on US exchanges but also on international markets. My stock trading strategies are based on trend trades. As you can see everywhere on these pages or in this tutorial my trades are made almost exclusively with prevailing stock market trend.
I have developed simple techniques for trend analysis. I want to share these with you in this tutorial. I have found the single most important indicator that helps me to understand the situation in today’s stock market.
This unique technical indicator is the 50-day moving average. When price on a technical chart is above the 50-day moving average, then your preference should be to make a bullish trade. If you see price on live charts below this value, you have to prefer to make bearish trades. This is the first basic key of this tutorial.
When to expect stock sell-off in shares
This part of my tutorial describes how to see indication that a bullish price uptrend finished and you can expect share sell-off.
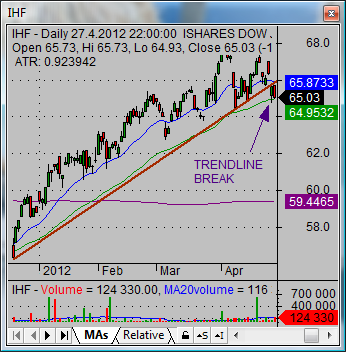
The first warning point is when share price that moves in a strong rising uptrend breaks below the trend line that defines this uptrend move. You can see an example of such a market situation on this chart of IHF – the healthcare iShares ETF

This situation indicates that uptrend is already exhausted and exchange traded fund shares need to rest for some time. It can lead to a continuation of this uptrend in near future or it could lead to a trend reversal for current ETF share prices.
The trendline breakdown should lead to some action. You have to start to monitor your positions in your portfolio more closely. You have to make your stop loss level tighter.
A confirmation for bear stock market trend change
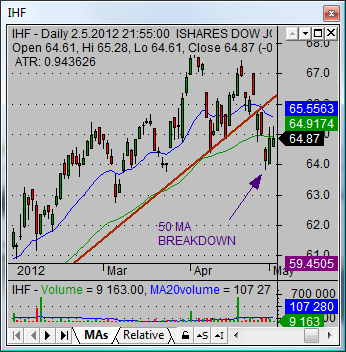
Now you have to wait for other signs of weakness that could develop on the technical price chart. The confirming signal for trend reversal into a bearish market situation is the final breakdown below the 50-days moving average.
It can be pretty quick as you can see on this second chart of IHF exchange traded fund. It happened almost immediately after breakdown of the uptrend line. This is another point to be taken from this tutorial.

Breakdown leads to bear stock market declines
The breakdown of the 50-day moving average very often leads to further bear market declines in share price. So if you use this stock market tutorial, then your immediate action is needed and you have to close your bullish position in these shares immediately to protect your profits.
Stock market tutorial video when to sell your position
Find more on related pages
- Morningstar ratings do not help you to decide when to sell index mutual funds
- Save four stock trading secrets about any investment strategy
- Read more details about best trading systems