The stock market crash chart is very valuable when you want to see what happened with stock prices during periods of great fear. There were several market crashes in the last 100 years.
The most known is probably the 1929 crash of stock market. But this is not the only one crash in the history of the equity market. There had already been crashes before, during previous centuries. The history of stock market investing is full of periods when irrational mania happens on different markets in the world and that leads to stock market crashes.
It is madness to think that crashes will not come. They will come again and again. We can expect that these crashes will repeat again in the future as a lot of investors are not able to learn valuable lessons that these crashes provide to them.
Therefore I think that passive investors, and also active investors and traders, should remember important investing advice when looking at stock market crash charts.
1929 stock market crash graph
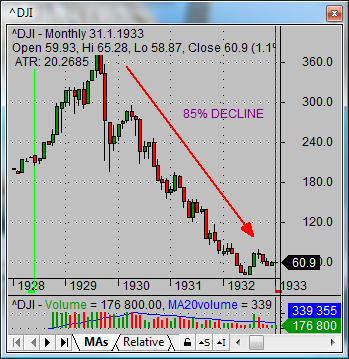
The most well-known and mentioned crash in modern history is the 1929 crash of stock market. This stock market crash in 1929 was fueled by a lending and credit boom that was provided as speculation. The bubble happened because many people were gambling with shares without really knowing the investing basics that are needed for profitable investing. On the stock market crash chart below you can see how deep the major index sank the during great depression crash.

Stock market investing basics provided by stock market crashes
1. “This time is different”
It is very common to hear this sentence. Every decade after some strong boom in one or more areas of the economy you will find people saying this sentence. Do not believe it. It is not different. A history of crashes shows us that some crashes will come again. When you hear such sentence, evaluate the area of the economy to which it is pointed and then wait for a bursting of the bubble.
2. The prices can only go up
This is also untrue. What goes up will also go down. It is correct that there are strong mid term trend moves on the market accompanied by pullbacks. But every trend will finish and change to the opposite. There are also times of bear trends on the market.
3. Fear is a much stronger emotion than greed
Share prices move up slowly. But when prices change their trend, downward moves are much stronger and the price moves down much more quickly.
4. Diversification will not help during panic
Panic moves across the asset class universe. Do not expect that you will be safe with commodities when stocks are being sold in panic. There are only a few safe heavens and they also do not work all the time. I would mention the US 10year Treasury Bonds or German Bunds – fixed income products issued by governments of the USA and Germany.
The great stock market crash of Nasdaq in 2000
5. What goes too much will go down a lot
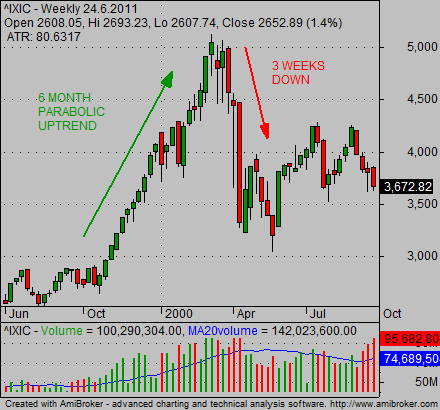
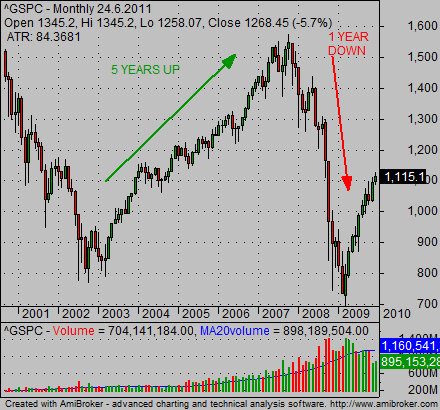
Just check some manias. The internet bubble moved price of the Nasdaq index up during six months in the final part of the bubble during 1999 – 2000, only to erase these gains in three weeks. The same happened in 2008 when the panic surrounding the S&P 500 index erased gains of the last several years.Check the chart below:

Stock market crash in 2008
The period of very low interest rates that had prevailed since the end of the Nasdaq 2000 bubble led to over leveraged financial sector and many strange financial instruments. Almost free money and big leverage led to a great boom of mortgage financing in the USA and also an explosion of government debt in developed countries.
When the bubble exploded, the stock market sank. Here is a stock market crash chart of the S&P500 market index during this period:

6. It can take a long time before prices will recover to pre-crash levels
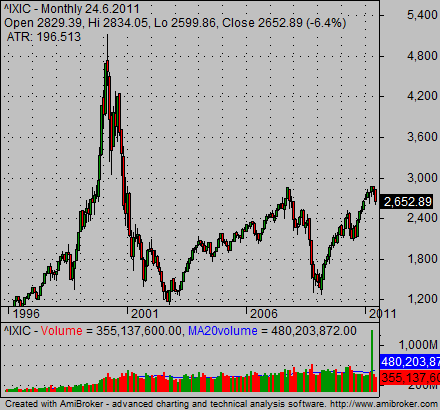
Sometimes there is only a mini crash which lasts only a few days or weeks and then the price recovers within a few months. But it can take years to recover from big crashes and as you can see in this stock market crash chart. The Nasdaq is still at less than 50% of its peak from the 2000 bubble. And it has already been more than 10 years (2011).

So what are my recommendations for handling of such situations?
Well we are not able to predict some crashes-like the Flash Crash in 2010 and natural disaster related crashes. Some can be expected, like the Nasdaq 2000 bubble meltdown or the Subprime crisis of 2007-2008. It is wise to be a more active investor rather than a buy-and-hold-only investor. It is wise to know how to read the charts and to take profits when price starts to move parabolic. It will drop down again.
Find more on related pages
- Ways to analyze Dow Jones index chart today
- How to find copper stocks for online trading & investing
- Inspire by other ways to invest money profitably in the stock market