Using stock analysis software is bread and butter of my technical stock market analysis. I use this charting software every day. It helps me to analyze share price charts but also it has market screening functions included so I use this software for stock market screening too.
It was not quick way to final selection of best stock chart software for my needs. I spent several months testing of different software packages. I have tested them not only for chart analysis during my pre-market trading routine but also in real time during US market trading hours.
Finally I selected one software that I like most till today. Its name is Amibroker. I use it every day. I analyze not only US market but also international equity markets, currency markets and commodities in this charting software.
When I have defined major market situation I use this software also to run my most profitable stock screeners. The list of stock picks is always fills with several gems that make a lot of money.
What you will like on this stock market charting software
Multi-time frame charting possibility
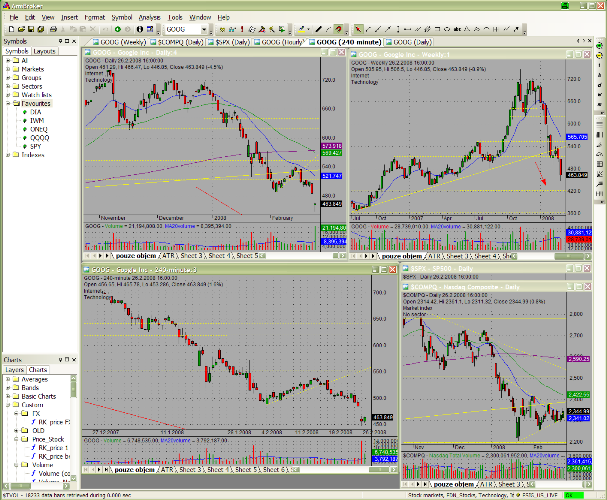
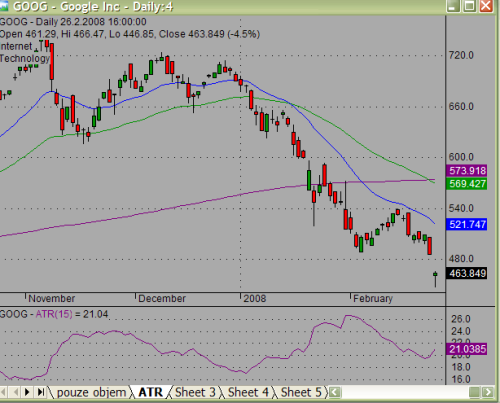
I like to have a different time frame chart of the same share symbol on the screen and see all of them together. My chart layout fits my needs. I have daily, weekly, hourly and four-hour price charts of the same symbol visible so I can analyze the technical situation very easily.
Stock group and watchlist management
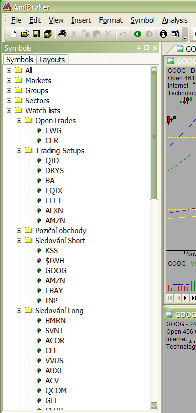
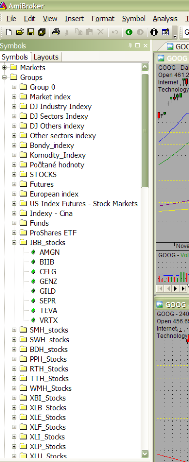
It’s very easy to assign any shares symbol to a group and have several watchlists, each one for different purposes. Stock symbols can easily be added, removed and moved between these groups and watchlists.
Stock database management and real-time data
I used several databases, one for U.S. stocks, one for U.K. stocks (London Stock Exchange), one for the local Czech market (Prague stock exchange) and another stock database for the German market (Deutsche Boerse). I also have one database for Forex symbols.
I can open several Amibroker programs, each one with a different database. This way, I can check shares listed in the U.S. or in the U.K. and also Forex trading without any complicated switching.
I use Esignal as a real-time data provider for all the databases I use. Amibroker offers the ability to use several different data providers, real-time and End of Day data. Several sources are free.
Stock screening is included in this best stock analysis software
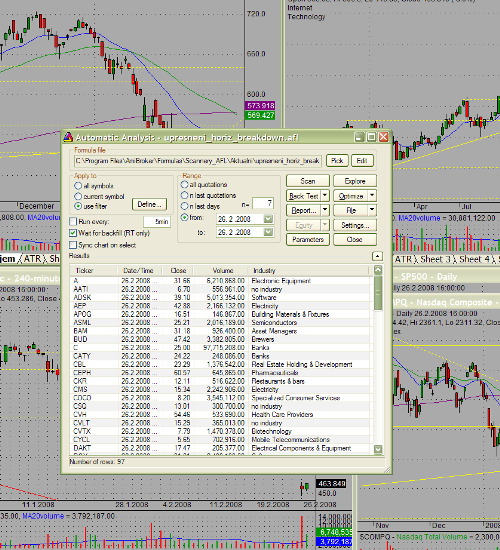
I use the its screening function a lot. It’s very easy to write some AmiBroker formulas describing my scanning rules and then run Automatic Analysis. I have my results very quickly, and I can do pick analysis very quickly. My most popular scanners are breakout candidates, breakdown candidates, stocks near a 52-week high or 52-low, stocks making a pullback during a trend, gapping stocks and more.
Easy charting of technical indicators
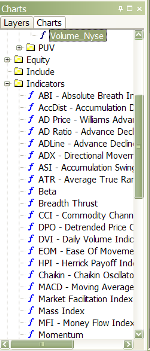
I can add any indicator I want to chart. I can modify parameters of indicators. And I can write my own indicator if I don’t find it in the list of indicators available. It makes this best stock analysis software very powerful.
Final thought about this stock analysis software
Amibroker has a huge list of features, and I don’t use all of them. The list is so huge that I think every trader can find what works for him when using Amibroker stock analysis software. Also, the price is very reasonable.
So if you’re thinking about best stock analysis software, try AmiBroker. I can recommend it. I’ve used it for several years already.
Find more on related pages
- How to analyze Nasdaq composite index charts
- Explore easy to read stock charts
- View also other stock market software options