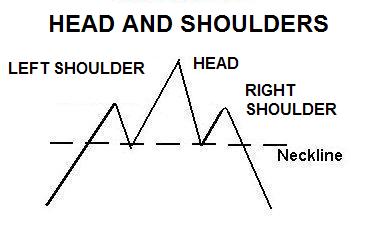
Head and shoulders is popular stock chart pattern. It is well known and used by a lot of technical traders. Its usage is on every time frame, so daytraders are trading this pattern on intraday stock charts, swing traders like trading these patterns on daily charts and position traders like to see this pattern on weekly charts.
This reversal pattern has two versions. One is bearish and it is typical shoulders and head chart pattern. Second one is inverse H&S chart pattern. Both have the same reliability.
There are typical trading rules how to trade these stock chart patterns. You can find them in almost every good book for traders. I have found also some advanced rules for trading chart patterns like H&S and you can find them in this chart pattern tutorial.
Classic H&S chart pattern
This is a bearish reversal chart pattern. It finishes an uptrend move and starts a downtrend move.

The left shoulder and head are created during an uptrend. The price retraces all the way down from the top of pattern, it means 100% retracement of a head uptrend move. This is first warning sign. It shows that the uptrend is weak.
Then, the right shoulder forms. A lot of supply is available from previous buyers in a head uptrend and creates a lower high, that is, the right shoulder. This is the last warning sign that the uptrend is finished.
Find more on related pages
- Rules to trade Head & Shouler pattern
- Bullish candlesticks patterns for stock traders
- Inspire by more details about other price charts patterns