Double top pattern can be found in different ways. The typical one is that trader does his/her own technical analysis of technical price charts and this pattern is available there. It is easy to spot this technical chart pattern during regular analysis routine work.
But if you look for the list of stocks with this specific pattern any trading day, it is better to use some stock market screeners. There are generally two options to filter complete stock market for a list of stock with double top pattern.
Web based free double top screener
The first option is to use a good online market web site with market filtering feature. There are several online market web-sites but not all offer such a technical screener. As an example I do not find this possibility on popular Yahoo stock market screener (03/2013).
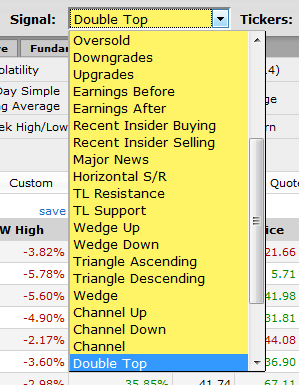
Anyway the best option you should use is the FinViz website. This site has powerful US stock market screener with many options. It is quite easy to scan for double top chart pattern using Screener option in Main menu of the site. The selection of correct signal, i.e. “Double Top” makes the trick.

You should combine this filter with other options for good stock picks. I recommend setting the limit for a stock price and good average trading volume. It creates list of tickers that are the most suitable for short-term or mid-term trading strategies.
Amibroker double top screening
Another option is to look for these price patterns using some automated trading software method. There is possible to use some good market charting software that could also perform scanning functions like Amibroker.
Registered users of this product has access to member only part of the site. There is a list of many formulas that can be used with Amibroker Automatic Analysis function. Some of them are designed for chart patterns recognition.
Find more on related pages
- Read basic description of double and triple top chart patterns
- How to short a stock with double top chart pattern
- Learn more about chart patterns