The dark cloud cover candlestick pattern is one of the most reliable patterns you can use in your trading and investing. You can use it for almost every style of trading you use – as a daytrader, swing trader or position trader.
Dark cloud cover candlestick pattern is based on combination of two single candlesticks. The first one long body white/positive candlestick is followed by red/negative candle that closes in the bottom half of previous white candlestick.
Dark cloud cover formation trading ideas
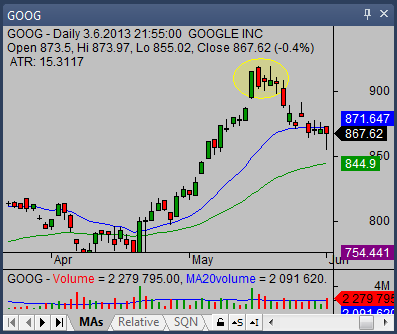
A trader can use this candlestick pattern in several different situations. You can be in a long (bullish) trade and your trade is working well. Finally you spot this pattern on the chart after some period of strong uptrend. This indicates that a move up could be at the end and it is a warning sign for you. You should expect a pullback.
You can see a typical example on the daily chart of GOOG shares

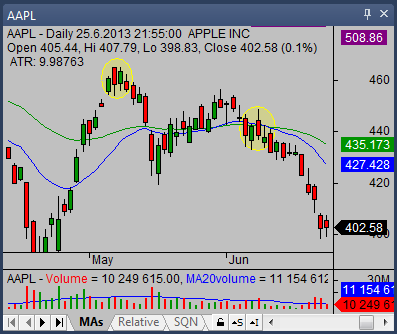
The second way to use this bearish reversal candlestick pattern is to use it for preparation of short sell trade. You can use it in a pullback during a strong downtrend. Such a pullback offers opportunities to prepare and enter low-risk short sell trade. When you see the dark cloud cover candlestick pattern formed after some pullback, you can start to think about possible resume of bearish trend move.
You can see two examples of the AAPL daily chart below. The first place is not exactly usable for short sell trade. But the second one already represented opportunity to enter a short sell trade in APPL stock. As you can see on the both examples, this candle pattern is sometimes not in ideal form so you have to be flexible when you look for dark cloud cover formation.

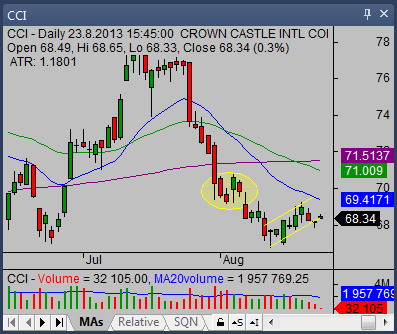
Final example shows dark cloud cover pattern in very small pullback. The small rest after strong decline was followed another leg down. You can see both on the CCI daily chart below.

Find more on related pages
- Read also about doji candlestick
- Morning star candlestick tips
- Explore further details in this candlestick tutorial