Stock chart patterns trading systems can be traded using classic or advanced trade rules. Almost every trader knows classic entry rules for chart pattern stock trading. But only good traders use advanced hints like these techniques for entering the trade.
Classic rules dictate entry into trade after the breakout of a major support or resistance line.
But this advanced technique allows entry into trade already during development of the final stages of chart patterns. An entry during the development of the right shoulder of the head and shoulders pattern or during the development of the handle of the cup-and-handle pattern is typical example.
Stock trading signals for advanced swing trade strategy
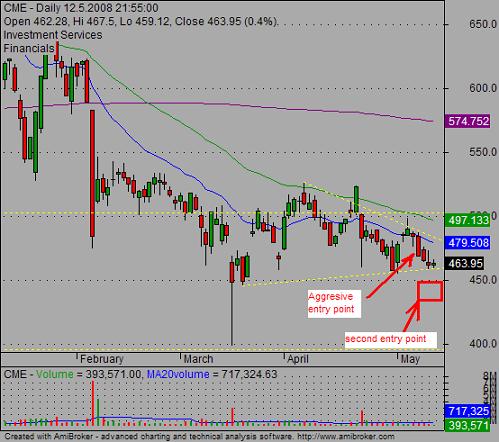
You can see weakness on a daily chart of CME below. The share price can’t break above its EMAs nor above the important 500 USD resistance level. After it returns under this level at the end of April, the next test is important. The failure at the beginning of May was the final trade signal to enter an aggressive short position in CME with a stop above 500 USD level.

These signals will be confirmed when the support line of the bearish pennant will break down.
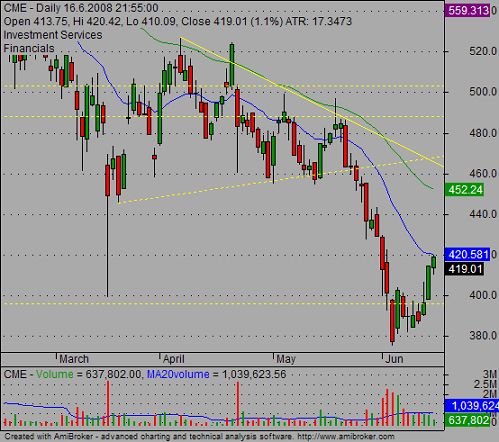
It happened a few days later, and this breakdown was the second possibility to enter short or add into an already opened trade. The target is set near the 400 USD support level.
You can see how this trade worked on the following chart:

A very important condition for using this entry type is that the you should closely monitors the share price for several days. It’s possible to find common patterns of behavior of a particular shares such as every morning rally fades by afternoon, which signals there are not real buyers in the this title. Such signals confirm your idea for aggressive short selling entry.
Find more on related pages
- How to trade stocks with double and triple bottoms stock chart patterns
- How to trade stock online with good entry selection
- Learn more about stock chart patterns