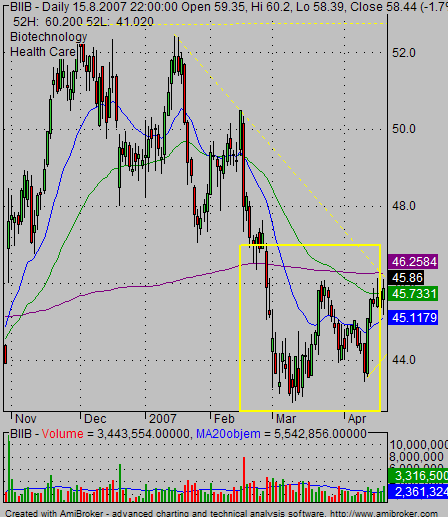
Double or triple bottoms are well-known stock chart patterns. They’re often called reversal patterns.
They signalize that an actual trend is coming to the end. It is not sure that the share price will immediately starts a new trend in opposite direction, but this reversal chart pattern is already a warning sign.
How to use technical analysis of charts to find this reversal chart pattern
You should to see these two signals to identify bottoms:
- the price made two or more almost similar bases
- the price retraced back more then 80% after each low
The retracement level technique is very good for the analysis of pullbacks. It helps to find what other traders do. Are they buying already? Or do they only wait for a pullback and expect next strong move down in current downtrend move ?
40% or 50% retracement level – as can be shown by fibonacci tool – is very common in good trend moves. But when the share price come back more in their pullback, then it is good to think more about a possible change in the trend. And such a change often offer a very nice market opportunity!

You can find an info about these reversal patterns in any basic book about technical analysis. But even so I think this is a simple but powerful chart pattern that can be traded in almost any time frame period of a good stock market system.
This pattern can be used also for a successful intraday system that trade the reversals. This reversal chart pattern is also very good for a technical analysis of stock trends in swing stock trade system or for position traders.
Find more on related pages
- Find how to scan for charts with this bullish pattern
- Stock trade strategy for double bottom chart patterns
- Learn more about different ways to trade stocks using patterns