Trendline is very simple technical analysis indicator that you should use in stock chart analysis process. It is very helpful in analyzing stock market trend and etf trend for my trading strategies I use for trades with stocks and exchange traded funds.
This hand made technical analysis indicator really works ! I can say it as it proved right many times during my stock trading career.
It is not something strange. It is not rocket science to use these trend lines. It’s nothing more than a line you draw into a price chart. But when you do it, you can see trend and also support or resistance levels very easily.
Creating such trend lines in good technical analysis software is not complicated. You simply connect important lows (for the uptrend) or important highs (for the downtrend) and extend the trend line into future. Done !
And the best part is that you’ve created a line that acts as support or resistance now and especially in the future! I repeat, in the future. You already have something that allows you predict what shares price will do in the future!
Trend line examples
But nothing is better than to see it on the chart examples. So here they are:

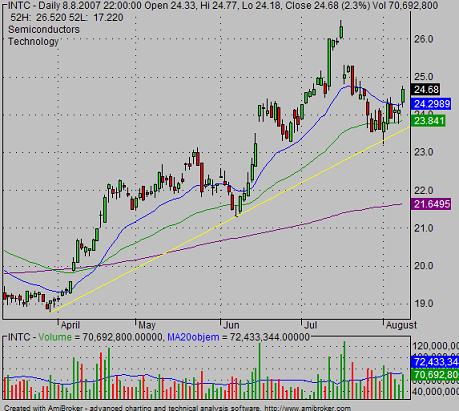
I drew the yellow trendline you see on the chart. It’s the technical line for an uptrend and it connects the first two major lows. The second low must be higher than the first low. Then, the third important low has been created but just on the this line. It works as a support line in this case. You can notice that the uptrend line has positive slope – it’s moving up. You can also find short body candlesticks, doji candlestick or hammer candlestick near the trend line.
Do not expect that the price will stop the pullback right on the trend line. You have to think about it as a price support zone.
Example for downtrend:

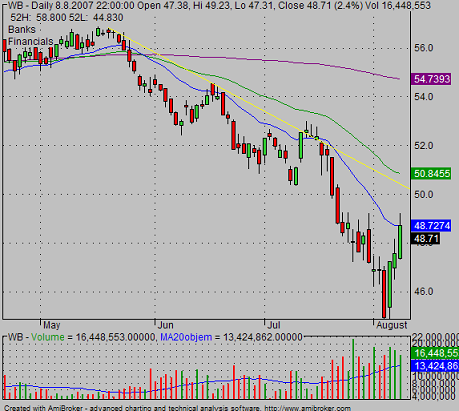
The line for downtrend connects the first two major highs. The second high must be lower than the first high. Then, the third important high has been created just around the downtrend line. It works as the resistance line in this case. You can notice that the trend line has a negative slope – it is moving down. You can also find the same short body candlesticks as on an uptrend line.
Trend line every day trading secrets
Please remember that every support can be broken! The same applies for resistance.
When you can draw a trend line through more than two important lows or highs (three or more), then it’s a much stronger support line. Bounce from this line or a break from it could be a very good opportunity for a trade.
When a trendline meets with a moving average, then that point is a much more important level of support or resistance.
Find more on related pages
- Understand reasons to look for bearish daily stock picks
- Inspire how to use best stock chart time frame setup
- Keep reading about stock chart analysis for profitable trading