You can find interactive stock charts on free chart sites like Yahoo stock charts, Google interactive charts site or Reuters. But are they usable? What are their major flaws?
These online technical charts are fine if you want to have an overview about the market situation. But they are not so good if you plan to use some market screener to find the best pick for your portfolio and then prepare a trading setup or ideal ETF trading pick.
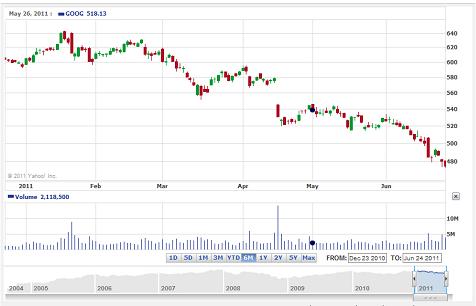
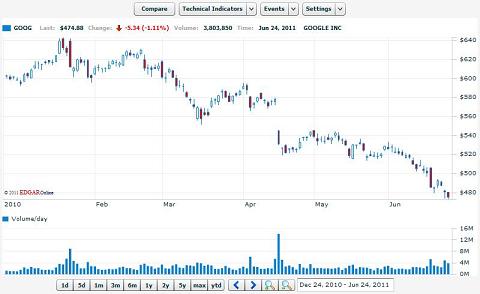
The main disadvantage of online interactive charts presented by these web sites is that their free interactive charts are not very customizable. They offer only limited options how their online graphs can be modified. What indicators could be used, what time frame and what time period can be charted. And finally their chart cannot be used as a realtime graph as their data are delayed.
Here are some examples of technical price charts from popular US chart sites.


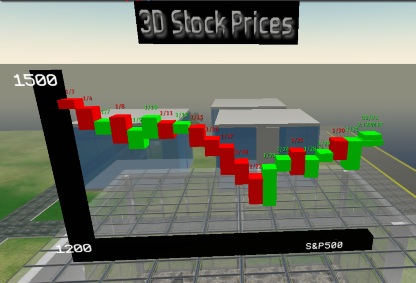
3d stock charts
Regarding this issue I would like to mention my opinion that looking for any type of 3D chart is a total waste of time. They are much worse for technical analysis than normal 2D graphs.

Is there some solution for free stock charts?
Yes , I have found one web site which is quite usable. FinViz offers technical graphs and a very good market screener. But to have advantage of full functionalities, you should consider using their paid services.
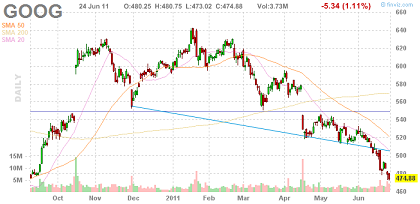
Their interactive graphs are really good if I take into consideration that we’re speaking about an online site. Their interactive stock charts already have visualized some important trend lines and support levels.
Here is an example of their technical stock graph available online.

Their site also offers several other functionalities such as market screener and much more. If you are interested in free online graphs or screeners, check their website.
Another technical chart option
When I am asked I recommend this solution. Buy AmiBroker software – it is a one time fee only. And then use some free quotes sources like Yahoo to update data in Amibroker every day, week or as you need. And customize your charts in Amibroker as you want. Select as many time-frames on one screen as you want, define your own technical indicators you want to use.
Customization is a very big advantage of using Amibroker with some data source for technical analysis. It is option to online interactive graphs available on websites, as mentioned above.
Find more on related pages
- How can copper prices affect stock market online trading
- Best books to learn beginner stock market investing
- Find better ways for chart reading