Every trading strategy you have placed in your system should have defined rules of when to sell stocks you hold in your portfolio. The biggest danger for any trader or investor is being caught without the knowledge what to do next.
So just as you need to know how to picks stock or what strategy to select for actual stock market situation, you also have to clearly define the main conditions telling you when to sell stocks. It is not necessary to have too large a list of such rules. I prefer simple rules for trading strategies and systems.
Technical rules for selling stocks
Technical rules are based on market technicals, mostly on chart analysis. Review of price charts is an important task that should be done regularly, even if you are a position trader or active investor and you hold your positions open for several months or years. Swing traders and daytraders rely almost exclusively on technical charts, so they monitor them every day.
The strongest signals helping to decide when to sell stocks are:
- Breakdown of uptrending moving average
- Breakdown of horizontal support level
- Reversal and large price retracement
- Development of some reversal chart pattern
Breakdown of uptrending moving average
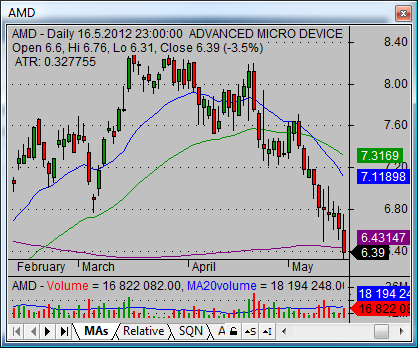
The share price in uptrend should hold above its most important moving averages. Typical values I monitor are the 20-day moving average and the 50-day moving average. A break of the 20-day is a warning for you. The breakdown of the 50-day average should be the final signal to sell stocks if you still hold them.

Breakdown of horizontal support level
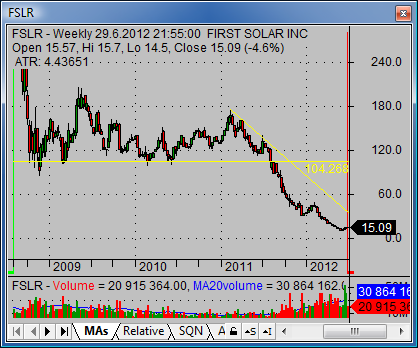
The breakdown of horizontal support level is another decision making signal for traders. Breaking of support is bearish price action and shares should be sold immediately. It is also possible to find this action in failed attempts to break some resistance and price decline back below this resistance. It is a signal to sell shares and exit the trade.

Reversal and price retracement
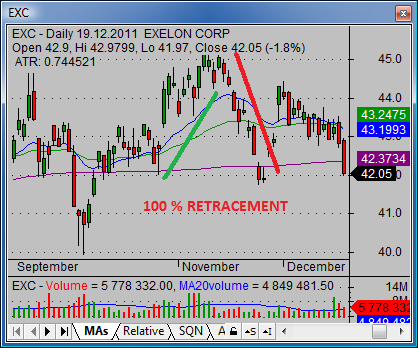
The full move retracement in price is another significant reason to sell shares in your portfolio. The retracement negates the previous move by moving price in the opposite direction. When this pullback in price is larger than 80% of the previous move then we should be alerted that something is wrong with this position.

Development of reversal chart pattern
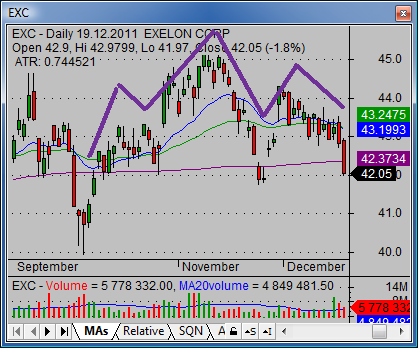
It is also possible to see development of some reversal chart pattern like double tops, double bottom and head-and-shoulders. The chart of EXC shows such situation.

Fundamental reasons for selling stocks
It is possible to incorporate some fundamental opinion for selling stocks. Although timing when to sell stocks is not easy using fundamental indicators, they could be valuable. The best is to use them together with technicals.
Selling stock short
Warning signs mentioned above are also important for bearish strategies. Selling stock short is a valid strategy and as such should be incorporated into your trading plan. All points mentioned above could also be reasons for selling stocks short.
One Reason To Sell Your Bullish Positions Video
Find more on related pages
- Learn to use the most popular inverse ETF shares for bearish trades
- Understand how to read weekly stock charts to make better selling decisions
- Read more about profitable stock trading systems