There are two ways to trade triangle pattern. Both can be extremely profitable. The key is to learn to trade this pattern very well and understand all basics about this pattern and its strategy.
Break of the pattern neckline trade strategy
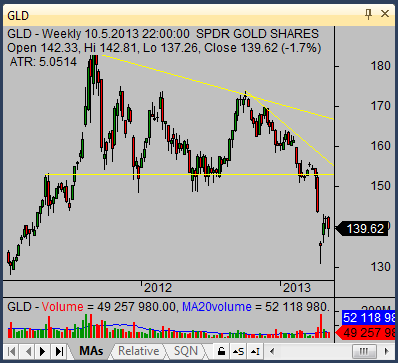
The first way to trade this pattern is to wait for breakout of ascending triangle chart pattern or for breakdown of descending triangle chart pattern. The triangle break could be very powerful and if you want to make money in such move, you have to enter the trade immediately after the break. You can see example of such strong breakdown in the price of GLD on the chart below.

Pullback strategy for entries
The second option to trade this pattern is to wait for pullback after neckline break of triangle pattern. It is more safe style to trade. But sometimes the break move is so strong that no pullback occurs and the move up or down goes without you.
Analyze stock volume
When you monitor triangle chart patterns then I would like to advice you to check volume.
The best option is when volume decrease during a time as these chart patterns are formed. It is OK. But you must monitor situation when trading volume is increasing above average levels. Then you know that something is happening. If the price is also breaking from the pattern it is good signal for entering the trade. It is very useful to have possibility to monitor shares volume intraday for such a purpose.
Do not set wide stop loss level
My golden rule in my system is that good trades are often good immediately from the beginning and rarely go too much against my idea.
So I recommend to set up your initial stop loss level quite aggressive and do not want to allow price to pullback against you too much.
Another tip I would like to stress is that intermediately as the price break from this pattern and the break holds, move trailing stop loss level just above/below breaking candlestick.