Technical analysis stock charts – both should play an important role in your trading and investing. The stock charts setups and simple techniques of chart analysis are two key basics for technical analysis accuracy.
If you want to make the best analysis then you should combine your technical analysis strategies and methods with several other tools. These tools represents another ways for improving results and accuracy of your trading and investing ideas.
Stock market charting software
Select and learn charting software that fit your your trading or investment style. There are many products available on the market. do your own research and test trial versions.
The price is not decisive as higher price does not automatically mean better product. There are many low priced products that are very good for beginners but also for advanced traders and investors.
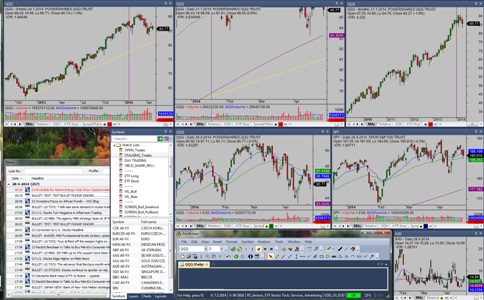
I personally use AmIbroker charting software. It is paid software, but the price is minimal and it is a one time fee. I can use different market data providers to push share price quotes for AmiBroker.It is very customizable software. And it is also a market screener function included in this software.
Here is a screenshot of chart setup for Amibroker I personally use these days

ETF List for technical stock market analysis
You should have list of major market indexes, several major sectors or other important parts of financial markets for a quick analysis of the market. This is should be fixed and created once.
Such a list will help you to determine what part of the market is strongest and what is weakest and where to find the best stocks to buy or to sell short.
I personally also use ETFs for such a purpose. I use ETFs also for trading and I trade exchange trade funds using my swing trading strategies.
A stock screener
Learn to use stock screeners. Such screeners will create a small groups of stocks for your individual analysis. You have not to go through all sectors and several hundred of stock charts to find a trading opportunity.
There are generally two ways to use screeners. You can have a screener function available in your technical analysis software or you can use external stock screeners and import resulst into your charting software for further analysis.
Simple technical rules for stock chart analysis
Keep you technical analysis simple. Do not use too many indicators and other tools. Find five or six indicators and tools and combine them. Keep your charts readable. Prefer to use several different timeframes instead of too many indicators.
Find more on related pages
- Find the best stock chart time frame setup
- Identify day trading chart patterns strategy that generate good results
- Read further details about stock trading strategies that work