Performance of individual stock sector plays important role in analysis of trading situation. The knowledge where is the strength and where is the weakness in the market offer possibility to select the best individual stock pick.
The strongest stock in strong sector is best candidate for bullish stock trade. And the best stocks to short will be located in weakest market sectors
Relative performance evaluation with line chart
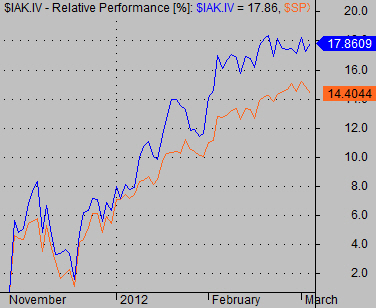
This option can be used with some good charting software that is able to set up a relative performance line chart. It is possible to define two or more symbols that are charted together using different lines on a single chart.
The relative performance is visible on such line chart. This type of price chart is a really good option for checking relative performance of several symbols.

This chart is an example of how it can be easily set in AmiBroker, the analysis software I use.
Spreadsheet as automated trading software for evaluation of performance
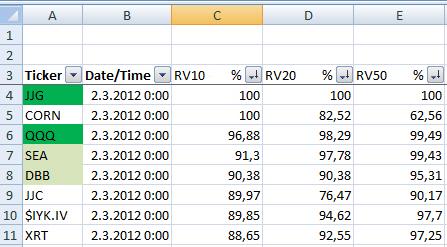
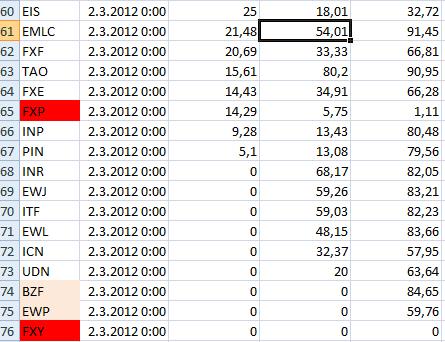
Another option is to use a spreadsheet program like Excel to calculate a table of relative performance for specific period of time. The sorting feature of such spreadsheet is then used to sort stock market sectors from best performing to worst performing sector.
The key is to be able to obtain performance data for measured sectors or their symbols respectively. I use excellent feature of AmiBroker software named Automatic Analysis that produce such data for me.
Examples of relative performance analysis of sector ETF symbols.


Complete stock market tutorial how to find best stock sector
I personally use relative strength analysis for selection of best performing sector that could be traded in coming days. The complete tutorial and definition of my method is not so complicated and anybody can use it easily.
Find more on related pages
- Improve your trading by evaluation of stock sectors
- Find the ways to use the most popular index etf shares
- Read more about stock screeners