Stock index charts are very useful tools that help to make more profitable trades. A market trader or investor should put regular analysis of technical price charts into his own trading and investing business plan that covers all his trading strategies or his basics of how to invest in shares.
The analysis of charts for important indexes is good not only for traders trading on US exchanges that will analyze the S&P500 Index, the Nasdaq 100 Index or Russell 2000 Index.
This analysis could also be performed using the index of the japanese market or shanghai exchange or with any other major index worldwide. You can also easily use index ETFs tradable on US exchanges to analyze a situation in almost every international exchange around the world.
Main aim of stock market price chart analysis is to find its trend
It is always hard to trade against trend. Stock index charts show the state of main indexes. You can see the general thinking of investors about markets. Do they want to buy and holding shares up? Or are they selling and pushing share prices down?
I do not like to trade against strong trend. I prefer to trade in the same direction as markets go. It is too risky to hold long positions when history price chart shows weakness and is dropping hard.
I monitor two parts of US markets: The technology part – Nasdaq – and broad US market – S&P 500 index. It also helps me to identify what sectors are stronger or weaker. It is one of my core know hows for trading – usage of relative strength analysis.
Simple trend analysis secret
Stock market trend is not a complicated issue. You only need a good and readable index chart you want to analyze. Any good charting software or best free online chart site should provide you basic tools for trend identification – moving averages.
My trend analysis is based on position of price to main moving averages I have placed on my candlestick stock charts.
You have to answer this question: Is the price under moving averages or above averages?
I use 50-day EMA and 200-day SMA to identify the global situation. Price above 50EMA allows thinking about long trades.
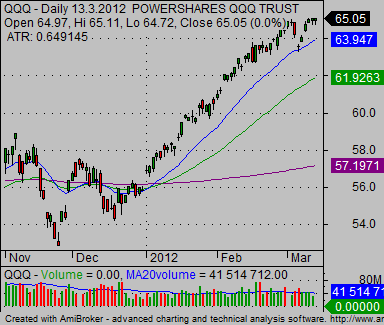
Here is a bullish situation example:

The 200-day SMA add another point. When the price is above the 50-day EMA and 200-day SMA then the situation is strongly bullish and I like to trade the long side aggressively.
When the price is under 200 SMA and 50 EMA then I prefer to be a short seller.

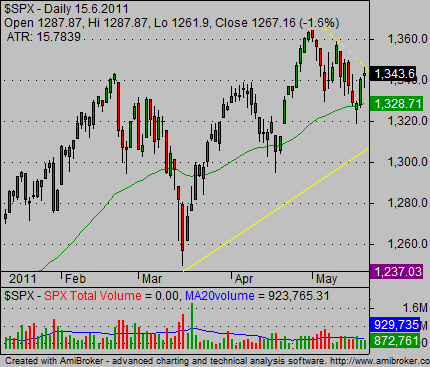
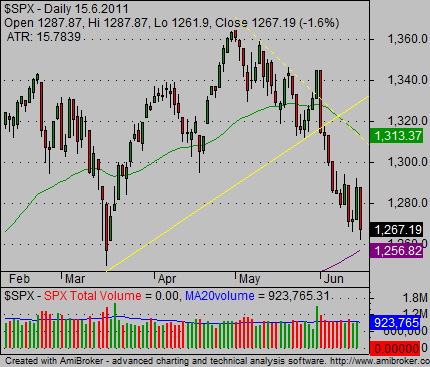
As you can see on the stock index charts above the situation can change very quickly.
Index etf funds for major index analysis
It is also possible to use alternative methods for research of major stock indexes and their charts. These indexes are now tracked by some index exchange traded funds. So it is possible to analyze any index that is now represented by index ETF shares.

Here you can see the Nasdaq 100 Index Fund price chart produced by my charting software AmiBroker.
Find more on related pages
- How to set the best stock charts online or in your software
- Use candlestick stock charts to find the best time to buy stocks
- Find out more about stock trading strategies