A stock market history chart is a good stock trading tool. Such a history chart can provide you many valuable lessons that could and should affect online trading & investing. Lessons that can be major terms of “stock market investing for dummies.”
Any historical chart of the stock market is able to provide many basics of stock investing for anybody who wants to listen. I think that these lesson are really valuable source of information for any beginner stock market investing activities.
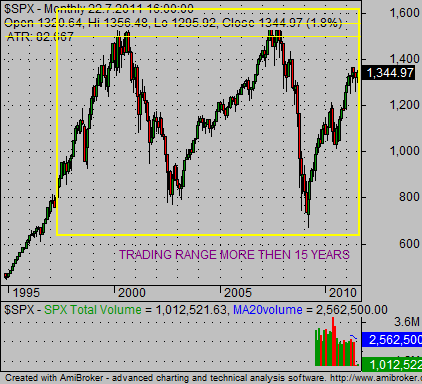
The most important issue from investing basics is nicely shown on the history chart below. It shows you that stocks prices do not only rise but also there are times when stocks prices decline. Sometimes very much.
The lesson learned from such a stock market history chart observation is that it is good to be a more active investor rather than a buy-and-hold investor. Buy-and-hold investors can have problems recovering from a long term decline in the market. It can take years to be break even.
And if you rely on investment income for your retirement it can surprise you a lot in the future. Your investment could also stay depressed and you will be without financial backing. Check this chart of S&P500 market index history. It made no gains in last 15 years. It is in trading range.

Further ideas from stock market history graph
- Another lesson learned is that it is worth it to use money management techniques.
It is wise to put money into several trades. But not into too many. You have to be able to manage all these positions simultaneously. If there is a critical situation and you can see a stock market crash chart, then you have to be able to manage all your open positions.
Your trading plan should include a part about trade management. You have to have an investing plan prepared. Where is your entry point? Where is your expected target/exit point for your trade? And how do you plan to manage your trade during this time? You have to implement a stop loss system into your trading system and strategy.
- Learn how to trade bullish positions but also how to use a bearish stock market for profitable short sale trades
Do you know only how to make money during a bull market? But there are always plenty of stocks or ETF shares which are in a downtrend. And what if the whole market is in a bearish mode?
Then it is wise to find stock trade opportunities to make money from declining prices. You can learn how to sell shares short or you can learn how to use inverse – short ETF shares.
- Long-term stock market history chart can show the current trading trend
It is always better to place your trades in the same way as the prevailing trading trend. If you can see uptrend history on your weekly or monthly charts then it is good to be bullish with your trades. If you see a downtrend, then you should have more bearish (short selling) positions in your portfolio.
It is wise to prepare several different strategies or systems for different types of situations. Several for a bullish market, several for a bearish market. You should also have some investing strategies prepared for a neutral situation.
- Stock market history chart shows you important levels of support and resistance
As you can see on the chart of the S&P500 market index above, there are two important levels for index. Until these levels are broken, we will stay in trading range.
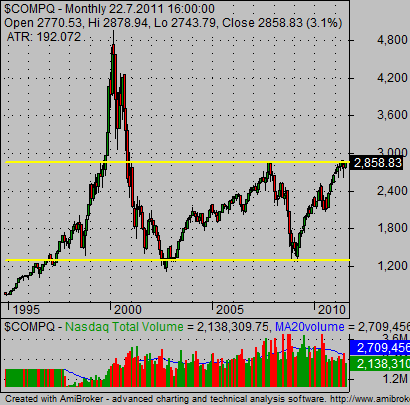
Here is the actual chart of the Nasdaq index.

We are now close to an important resistance level. If the index is able to manage a breakout of this level, we could start a new bull stock market move in technological shares.
Find more on related pages
- Three lessons that must be taken from 1929 crash of stock market
- Stock market crash chart provides valuable lessons
- Find more best ways to invest money