One of the little secret to know how to trade stocks online profitably is to use bullish candlestick patterns in uptrend moves. After finding list of ideas stock picks for bullish stock trading strategy, you can increase the chance for big profit simply using knowledge about the positive candlestick chart patterns,
You can use candlesticks patterns in any trading style. Position and swing trading strategies will benefit from them as well as the intra-day traders.
Bullish candlestick patterns
The best way is to use a simple form of candlestick patterns. Therefore you should prefer single candlesticks or combinations based on two candles. The most profitable strategy use combinations that consist three candles to enter an online trade when the third candle is formed.
You can be sometimes early, but if your pick is really strong and could really be the best stock to buy today, then there is only a small probability that creation of such a pattern fails.
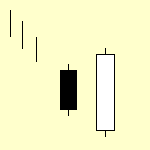 This is the best pattern I use and prefer. It is a bullish engulfing pattern. I like to see these two candles formed near some support level after a share price makes a pullback. This pattern is most useful in pullback online trading strategies.
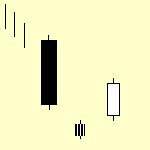
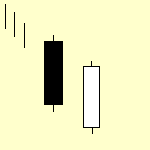
Another possible candlestick patterns that could be used for a pullback entry is shown below. All of them allow you to find good entry points and initial stop loss levels with a minimal risk.
Short term stock trade example
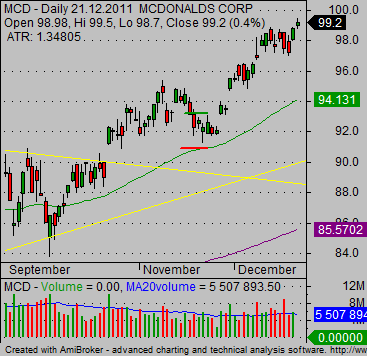
This is an example that can explain the idea of how to trade stocks online using bullish candlesticks. This is a bullish price chart of MCD. This ticker started a new uptrend leg after a breakout from a bullish chart pattern. After the initial breakout move it has done a pullback. Previous resistance now serves as a support level and the price starts to form reversal candlesticks there.
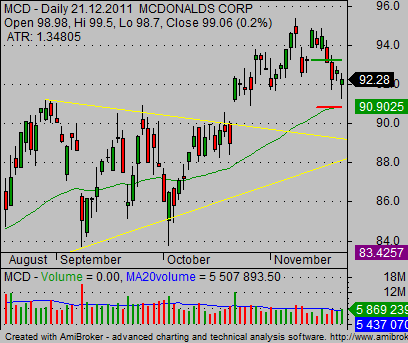
I have drawn lines that represent good entry points (green line) and an initial stop loss level (red line). Please also note that the last candlestick was accompanied with strong above average volume. It provides another hint that the price move is going to reverse and we could expect a new uptrend move soon. You can expect for that the price will make a new high above the previous high.
The second stocks chart represents a situation after a some time. The trade has worked well and the price moved into a new high near 100 USD level. It is a strong level that could represents a psychological target. Now we have to use trade management rules for setting a new trailing stop levels or for taking profits in this online trade.
Find more on related pages
- Best ways to trade bearish candlestick patterns
- Learn the importance of a single candlestick
- Find more in candlestick tutorial