Tip that saved me a lot of money in my online trading
This stock market trading tip is one of my personal stock trading secrets. It’s based on several years of active trading. I discovered it when I did my regular analysis of my history of online trades using my journal software.
I would like to share this online advice about trade exit with you as I think that it is important to know how to trade stocks when this situation appears on price chart. This is one of online trading tips that uses candlestick chart patterns and their analysis on the graph. The usage of this online trading advice about trade exit is especially for short term market strategies. But a self directed investor could use this trade exit advice based on my trade history too. It can serve for his positions that he holds for mid term time period like few months.
Failed breakout exit strategy
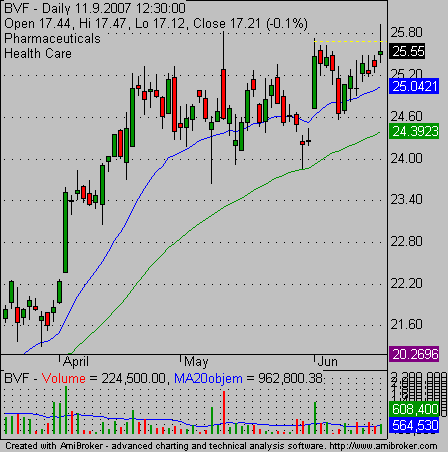
This stock market trading tip can be used if you’re entering a breakout trade. The breakout could hold, but sometimes breakouts will fail. Such a failure is demonstrated by a single reversal of a candlestick. The price during a day is trying to move above the resistance level, but it fails. The closing price is again below this resistance level.
A single candlestick with this shape is known as a shooting star (for breakout failure) or a hammer (for breakdown failure).
Look at this example of a failed breakout of BVF stock:

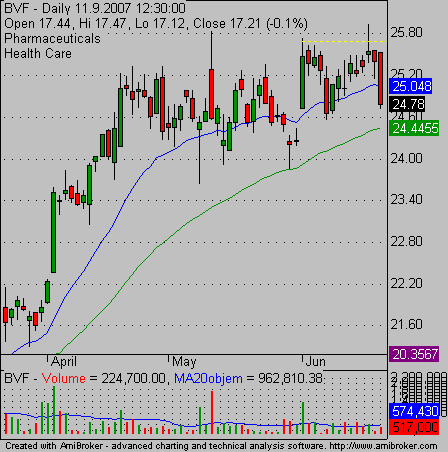
and what happened few days later:

How to handle failed breakout in your stock market trades
The recommendation and tip I want to tell you is quite simple:
Do not wait, and if you see a negative candlestick, which provides information about a failed break of resistance or support, exit trade immediately.
Do not wait for your stop-loss exit. Based on my market knowledge, 95% of such reversals will reach your stop. So, it’s much better to leave a trade with a smaller loss than to wait for your stop-loss to be triggered.
A tip for your chart analysis
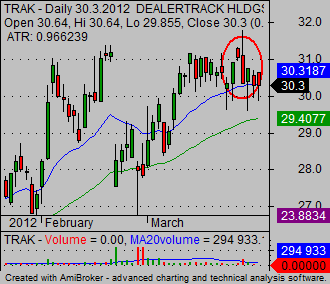
Similar principle can be also used when analyzing possible opportunities for next opportunities in breakout strategy. I regularly produce list of good candidates for such trades using my breakout market screener and then I go through list manually and check every single ticker and its technical price chart. Sometime I spot similar situation like is this one on the chart of TRAK.

The candlestick stock chart of this exchange symbol looks quite bullish and I would consider it for possible bullish breakout stock market trade. But there is one negative issue that is like red sign for me.
It is bearish single candlestick accompanied with above average volume level. Although price has not dropped too much yet I see it as real warning sign and I delete this ticker from the list of possible candidates for bullish breakout trades.
Find more on related pages
- Identify performance of individual stock sector to make more winning trades
- Understand double tops reversal stock chart patterns
- Find more details about systems for stock traders