There are several options on how to trade commodities. You can use commodity ETF shares that offer an easy way to trade commodities without the need to trade commodity futures or real metals in London directly.
These commodities are traded on US stock exchange as funds and they act like standard shares. So it is easy to buy and sell them during US market opening hours.
They can also easily be sold short and so it is possible to use them for short selling trades. Short selling is an ideal way to make money in a bear market situation or when specific shares are in downtrend.
Two ways to trade commodity ETF in a bear market
There are two major ETF strategies for downtrends that I have placed in my ETF trading plan. They also can be used well to trade commodities.
The first option is a breakdown strategy that is used when any commodity ETF is going to break down an important level of support and we can expect that a new down-trend move is going to be established. This is a little riskier strategy as such breakdown can fail if the broad market is still in bullish mode.
The second option is to use a pullback strategy to trade commodities funds. It enters a trade in pullback after a previous breakdown. This strategy could be little bit less risky way how to trade commodities in a downtrend.
Pullback means that we could already identify a major breakdown on stock chart of specific commodity ETF. And as the classic support/resistance rule defines, former support changes to resistance after a successful breakdown.
The strategy expects a small correction to this new resistance level where price move is going to stop and reverse to a downtrend move again.
How to identify downtrend and resistance level in commodity exchange traded funds charts
If you want to know how to trade commodities in a bear market situation then the first step is to check that any particular commodity ETF is in downtrend.
A downtrend in shares is established after major trend reversal, when a stock finished an uptrend and then trades sideways in price range for some time. Final breakdown of such price range is often the beginning of a new downtrend move that can last several weeks or months.
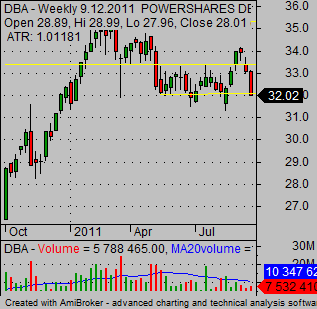
Here is the agriculture ETF chart analysis with a weekly candlestick chart. You can see an established price range that happened after the end of a strong uptrend move from previous months. DBA tried to break up from this price range but failed and moved back down to the bottom support level of this range. It indicated big weakness in this Agriculture ETF. It is possible to expect that this exchange traded fund will try to break down this support level.
But the daily situation shows that this exchange traded fund already made a big move from the top of the range to the bottom of the range and could be little bit “tired” for a new strong breakdown. Also, previous attempts to make breakdown failed weeks ago. Details could be found on this candlestick chart.
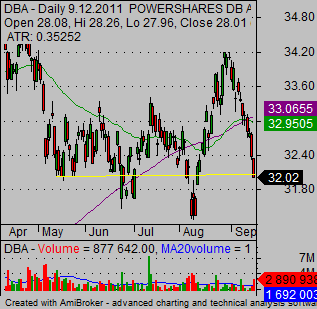
A better strategy could be to wait for a breakdown to happen and confirmation that it has not failed. And then wait for the pullback to make the best trade setup with these commodities funds.
DBA exchange traded fund chart analysis
If you waited a few more weeks you could see this major development of price on the chart of this DBA exchange traded fund.
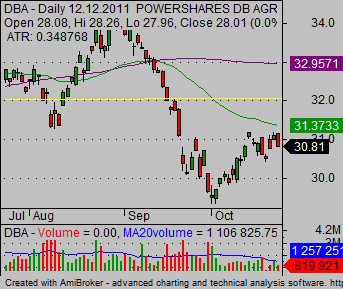
The first important point is that the price made a breakdown and it was successful. The second point is that the price is now in a nice pullback and has moved back to the 50-day moving average. Now we can see that the price stalls near this important resistance level and indicates possible reversal. It is time to prepare a stock trading setup with this commodities fund.
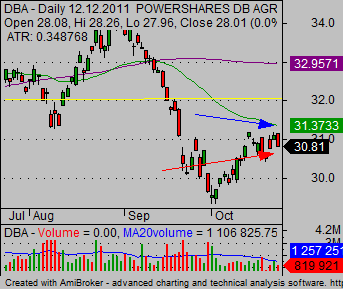
This next ETF chart shows my proposal for entry point (red arrow) and for stop loss level (blue arrow). I would expect that price will make a new move down below the last low level near 29 USD.
My target will be set slightly above the next important support level that can be seen on weekly and monthly charts of DBA Agriculture fund. This support level is near 27 USD. So I would expect that price will go down to 27.50 – 28.00.
This trade setup offers possible three points of reward while risking approximately 0.70 USD per share. This is a really good risk reward ratio of 4.28.
DBA stock trading chart with current situation
The current situation can be seen on this stock trading chart of Agriculture fund DBA. The trade develops well and using our trade management rules you can move a stop loss level to a new point that is already in profit (green arrow). You cannot finish this trade in a loss and you can wait to see if the trade will reach an expected target near 27.50 USD.
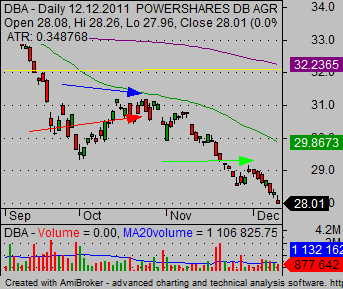
This trade example could show you how to trade commodities in a bear market or in downtrend moves. I think that this type of ETF strategy should be incorporated in any trading system that also wants to trade commodities.
Find more on related pages
- Inspire by an example how to trade gold etfs online
- Ideal copper ETF for commodity online trading & investing
- Collect more details about ETF Trading strategies