The question of “How to read stock chart” is answered simply from my side. When I receive such a question I reply every time that simple technical graphs are much more readable than long -term or short-term stock charts with many indicators.
Many short-term or mid-term traders, but also active investors, tend to use and read share price charts with many indicators. They think that using some good technical analysis indicator improves results of their strategy for traders.
They finish with a technical chart that is filled by many different indicators. Such graphs are not good for the decision making process in any trading strategy, as the trader experiences “analysis – paralysis”. There is too many information provided by every technical analysis indicator on a chart, so that a trader or investor is not able to read such a graph properly and decide what to do.
I experienced a similar situation when I was in early stages of learning how to trade shares on US markets and read graphs several years ago. I used plenty of market indicators and also day trading indicators on my live charts. But I finished in a situation where I was not able to read situations properly and make any trades as signals generated by these indicators were not synchronized.
Read & use simple stock market price chart
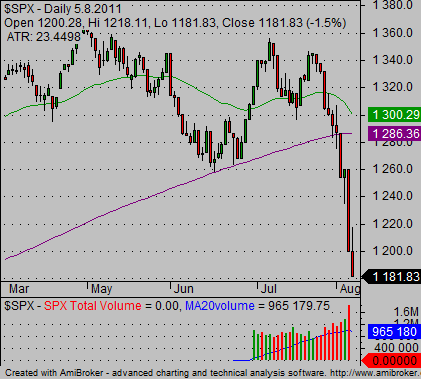
My typical share price chart for technical analysis looks like this graph of the S&P500 index:

My ETF trading strategies are based on simple trend analysis of these charts with minimum indicators applied. As you can see, there are only candlesticks, two moving averages and volume. And trendlines I draw manually into such a graph. All is easy to read and analyze.
Stock price chart with more technical indicators
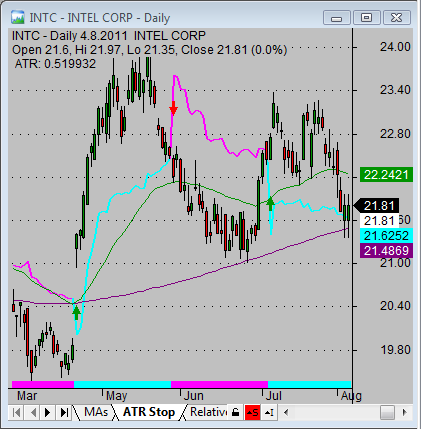
Sometimes it can be useful to use more technical indicators for technical price analysis. I started to use another set of indicators for better trade management. I monitor ATR stop indicator. The value of this indicator helps me to manage my open trades. When I think about new value for my stop loss level I look at a chart with ATR stop indicator.
Here is a typical example:

But this graph is not used for analysis, only for monitoring of trailing stop level. So I do not want to have it all in one chart and read them together. I want to have one technical chart for chart analysis and a second one for trade management purposes. How to handle such issue?
One possibility is to create two charts of the same security in your charting software and then switch between them. It is possible but it is not a very nice way.
Some investors use some form of free charts available online. It is complicated to watch more than one single price chart at the same time when using these online trading sites. It is not possible to read and analyze the situation properly. So it is not as easy to use similar trading tools for reading free stock charts as are available in the best charting software.
Good stock chart software has tabs
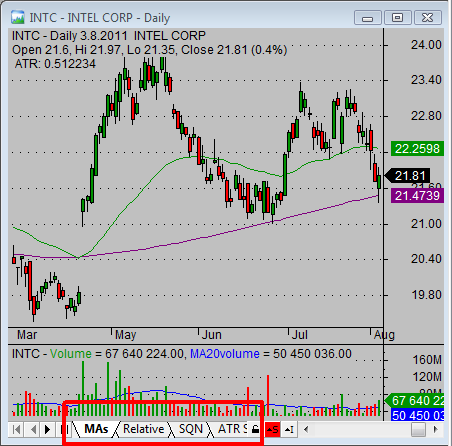
I prefer another way to handle this issue of “how to read stock chart and have more stock market indicators”. My recommendation is to use TABS on technical charts. What are tabs? Check this example below. You can see special tabs for different technical graphs. It is similar to tabs in Excel for different sheets. One tab could be for the most important price chart. And the next for another way of analysis with an additional indicator.
Here is an example of tabs in Amibroker – my analysis software:

Find more on related pages
- Copy these ideas for reading stock charts to your trading system
- Learn how to sell stocks and achieve maximal possible profit
- Gain more knowledge about chart reading