Knowledge of today’s stock market situation is important for short-term stock traders. This information is key for selection of the best strategy for the stock market today.
It is much better to look for bullish type of trades when the situation in the day’s stock market is positive or outright bullish. These bullish strategies are usable also when today’s situation is neutral.
A bearish mood is an indication for usage of bearish or negative trade strategies. These strategies use short selling to generate profits.
The stock market also often does not offer significant trend. It can be choppy or move within a trading range. A good trader also has prepared strategies for what to do in such situations.
Stock market today in intra-day analysis
There is little difference in how the mood of today’s stock market is used by intra-day traders and how this know-how is used by short-term traders for swing trading strategies. Day traders generally take care of how today is going to start. They really care about today’s situation. They need to know the situation only for one single day.
They can start with analysis of a broad market situation, as is described below (the same analysis the swing traders do). But finally they need to check the behavior of today’s mood on the exchanges.
They can do it simply by analysis of development of a technical price chart as it develops during a trading day. But there is also one technical indicator that could define the breath or health of the actual situation on exchanges.
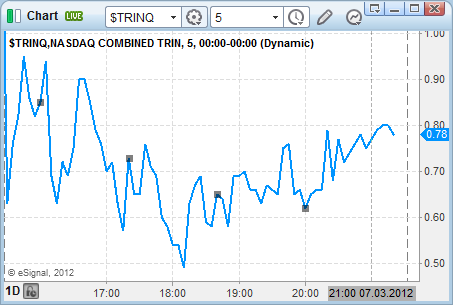
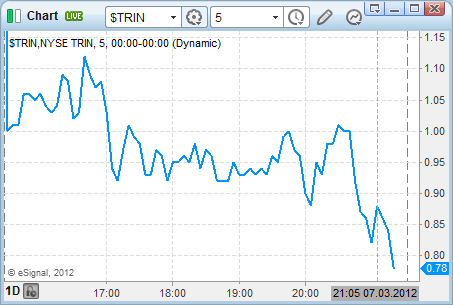
Its name is TRIN, known as the Arms index. It is mostly used on Nasdaq stocks, as the Nasdaq represents a better playing field for daytraders. This indicator calculates overall mood of the Nasdaq exchange. It uses a number of advancing and declining tickers and also includes traded volume in its calculation.
A TRIN reading below 1.0 is “healthy” i.e. the traders prefer to be long . A TRIN reading above 1.0 is “sickly” and the bias is down. In general, a range between 0.75 and 1.25 is flat or neutral.
Here you can check sample charts of the TRIN index calculated intraday for Nasdaq and for NYSE stock markets.


The extreme points to watch in the TRIN are around 0.30, which shows frantic buying and a possible top. And then readings above 2.0, which suggest excessive doom and gloom and the possibility of a short-term bottom.
It is tough to use this stock market indicator for spotting reversals as the extremes on the TRIN can get pretty extreme. TRIN values of 9.0 and also 0.16 have been seen and the market kept going. So the better option is to use TRIN for definition of overall trend in today’s mood on exchanges.
Basics of stock market mood analysis for swing and position traders
Swing traders prefer to know the short term mood of the stock market. They use analysis of technical price charts to define short-term trends. This short-term trend represents the major direction that exchanges or their major indexes experience right now.
There are several different ways to analyze what the major trend is in today’s stock market. It is possible to use several different technical chart indicators to define bullishness, bearishness or neutrality of today’s mood on exchanges.
I personally like to do simple analysis, so I use simple basics of technical analysis to define today’s situation. I use moving averages for analysis of daily charts.
I see a positive trend when share price is above the 50-day moving average. Such a situation is very good for positive bullish trades that expect to rise price. A strong bullish trend is defined when the price is above its 50-day moving average and above 200-day simple moving average.
Similar observations can be used for bearish or negative situations. The price should be below these moving averages.
It is also good to know when the situation is neutral. It is possible to use both strategies in such scenario.
How to use info about today’s mood for trading
I mentioned that knowledge of how the stock market is trading today is quite important for daytraders to select the best strategy for the current day. They should decide to go long – do bullish trades, or go short – do bearish trades.
Swing and position traders should also use this knowledge for selecting the correct strategy for their trades. They should use it for screening purposes, as they will prefer type of a screener that produces results for their preferred strategy. I mean to use the bullish breakout screener for a bullish strategy in a strong bull trend.
Every trader should also understand that there is also a third option to bullish or bearish trades. It is possibility to stay in cash and not trade, not open any new trade. If the situation is not clear, then it is the preferable solution and there is nothing wrong with it.
Find more on related pages
- Some tips how to trade iShares ETF
- Locate how to become profitable pattern day trader
- Understand also further details about profitable stock trading systems