The Dow Jones utility average is a very old index. It can be considered as one of the Dow stock market indexes from Dow Jones history. This average was created to track companies that deliver all major utilities for US industries and also regular daily residential usage – electricity and natural gas.
This Dow Jones index has not changed a lot during its history compared to other Dow Jones averages. The changes that happened were the result of mergers or acquisitions. The current listing of companies in this average is here:
AEP .. American Electric Power Company
AES .. The AES Corporation
CNP .. CenterPoint Energy, Inc
D .. Dominion Resources, Inc.
DUK .. DUKE ENERGY CORPORATION
ED .. Consolidated Edison, Inc.
EIX .. Edison International
EXC .. Exelon Corporation
FE .. FirstEnergy Corporation
NEE .. NextEra Energy, Inc.
NI .. NiSource Inc
PCG .. Pacific Gas & Electric Co.
PEG .. Public Service Enterprise Group
SO .. Southern Company (The)
WMB .. Williams Companies, Inc. (The)
How to create a graph for utility average
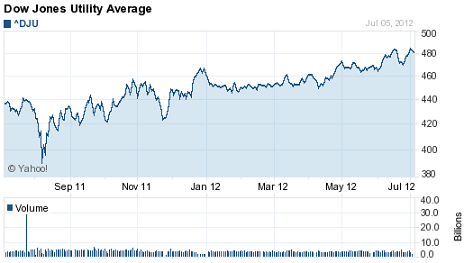
There are generally two options that could be used for analysis of a situation in the US utility sector represented by this Dow Jones average index. You can use some good online market website that produces good Dow Jones charts. The example of such site is Yahoo financial, where you can monitor Dow Jones closing history and also actual situation.

This type of chart is good for general observation of the situation in the utility sector represented by this Dow Jones average index. If you plan to trade the utility index or individual utility stocks on US exchanges then I recommend using a second option – some good chart analysis software.
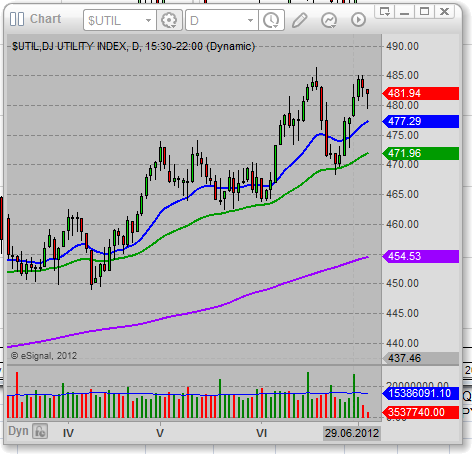
Good chart analysis software could arrange much better charts of any stock market symbol, including Dow Jones averages.
Here is a sample chart from stock trading software I use personally.

How to analyze charts for utility Dow Jones average
The main issue for analysis of these charts is to look for actual behavior. Is the price of the Dow Jones utility average index trending up, trending down or is it moving in some price range? The answer to this basic question should be determined by analysis of any Dow Jones graph for the utility sector. The answer should also define the type of strategy you have to use for trading this specific US sector.
How to trade utility sector using etf
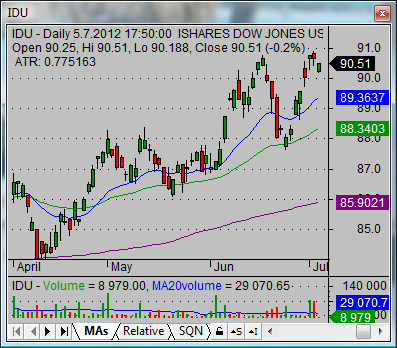
There is not a direct Dow Jones index fund that tracks the Dow Jones utility average index. The closest proxy is Dow Jones U.S. Utilities Sector Index Fund with stock market ticker IDU. This sector exchange traded fund represents the best how to trade situation in the US utility sector.
This iShares ETF for US utilities holds more utility stocks in its portfolio but, as I noticed, its price movement is very close to the Dow Jones utility average index. The graph of this Dow Jones average develops quite similarly to a stock price chart of this utility sector exchange traded fund.

Strategy basics for utility Dow Jones stock index
I trade iShares utilities exchange traded fund with same basics I use for general ETF trading strategies. The first step is that this Dow Jones index fund should appear in the list of best ETFs for trade I select with my ETF picking method.
Then I apply other tools of technical analysis to prepare the best trading setup for this ETF. The ETF trading system uses breakout or pullback trading strategies that include candlestick patterns or stock chart patterns for ETF chart analysis. Risk management rules are included in the setup preparation process I use every trading day.
Find more on related pages
- Strategy to trade Dow Jones industrial 30 companies
- Ways to trade Dow Jones transportation average using etf
- Read more about ETFs