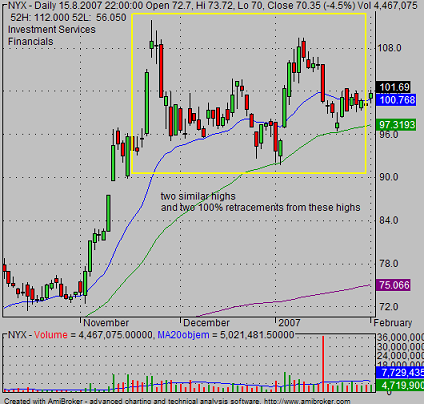
Double and triple tops are common chart patterns. They can be found on long term charts based on daily, weekly or monthly time frames. But they can also represent also intra day pattern on price chart with one or several minutes period.
The validity of this chart pattern is usable for short term traders like daytraders or swing traders. The huge version of this reversal chart pattern can be found also on weekly charts and can be used by in position trade strategies or by active investors.
This type of reversal chart pattern is generally considered bearish as it confirms end of significant uptrend and consolidation period. The break of this pattern to the downside is very good opportunity for short sell trade in swing trading strategy.
Similar breakdown on intraday chart represents also good opportunity how to make a winning day trade using one of pattern based intra day trading systems.
Tips how to recognize double top patterns
These reversal chart patterns are one of the very well-known price patterns. You can find them on a chart based on these conditions:
- price made two or more almost similar highs
- price retraced back more then 80% after each of high
Double and Triple patterns are often known as reversal chart patterns. They signalize that last trend move is probably finished and stock is now in trading range or is changing direction of the trend totally.
When I analyze share price charts using technical analysis I often like to use fibonacci retracement levels. They help me to understand what other player on financial markets do. Are they selling into last uptrend move? Or do they only wait for pullback and expect another strong move up in current uptrend move ?
40% or 50% retracement level is very common in good trend moves. But when share price come back more in their pullback, then it is good to think more about possible change in the trend. And such change often offer very nice trading opportunity ! As you can see on examples below.

These chart patterns are used in stock market strategies but also in strategies trading other assets like commodities or currencies.
Find more on related pages
- Find how to scan for double top or bottom chart pattern
- Identify the most important US stock market trading hours
- Gain more info about trading stock chart patterns