Doji candlestick pattern is popular in trader’s community. Many traders tend to place huge significance to any doji pattern that is presented on the chart. Here are tips how to avoid mistakes and traps that these traders do.
Basic doji is a single candlestick. The typical definition tells that it is japanese candlestick with opening and closing price almost the same. This pattern has several possible shapes. Check the images below.



You can find also doji patterns based on two or more candlesticks.
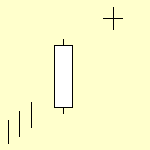
Doji candlestick meaning
The major value provided by this single candlestick is that the market is in the rest. Buyers and sellers are not able to overcome each other so the price does not move a lot during a trading day – a typical period for single candlestick on daily chart.
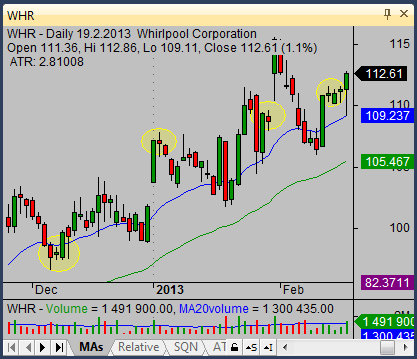
Doji candlestick analysis
The best analysis for any candlestick is to look for these patterns only in the most important form. As you can see on the chart above, the doji is many times on the chart. But only few occurrences has significance and can be used for trading.
You have to learn how to find the most important occurrences of this pattern. These important places are defined by support and resistance levels. Doji confirms such levels and offers hint for possible move reversal.
The most valuable presence is when this single candle is combined with support (for bullish trade) or resistance (for bearish short sell trade) after previous extended move.
Check this chart example. There are several areas where doji pattern has significance for technical situation analysis. Any of these areas presents an opportunity to prepare and realize bullish stock trade.
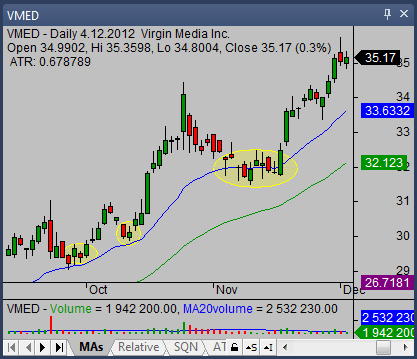
Trading strategy hints for doji candlestick
The most valuable know-how is that you cannot set up the trade based on the doji alone. You have to see the context and overall situation.
The first step is therefore to define major trading trend for monitored ticker. Doji then helps you to precisely prepare a trade in the direction of this trend.
You should find some of doji candlesticks near or at important support or resistance level. Doji together with other short body candlesticks could define small area that could serve as a basic for trade opportunity.
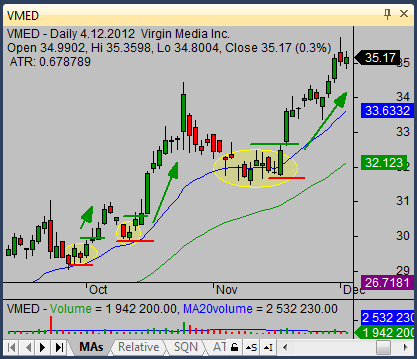
The trade idea expects that the price reverse and starts to move in the direction of the major trend. The chart above shows three possible trade opportunities with green line as possible entry points and red line as possible stop loss levels.
Find more on related pages
- Read also about hammer candlestick pattern
- Learn about dark cloud cover candlestick pattern
- Find more about patterns in candlestick tutorial